Member Pulse puts a member’s timeline, lifecycle stages, experience map, interaction stream and tenure in one inspectable application.
5 views. Count of the original view structures: Timeline, Stages, Experience Map, Pulse Stream and Tenure. Not five deployments or a measured retention gain.
12 signals. Source-defined signal model.
Read the story before deciding the next step
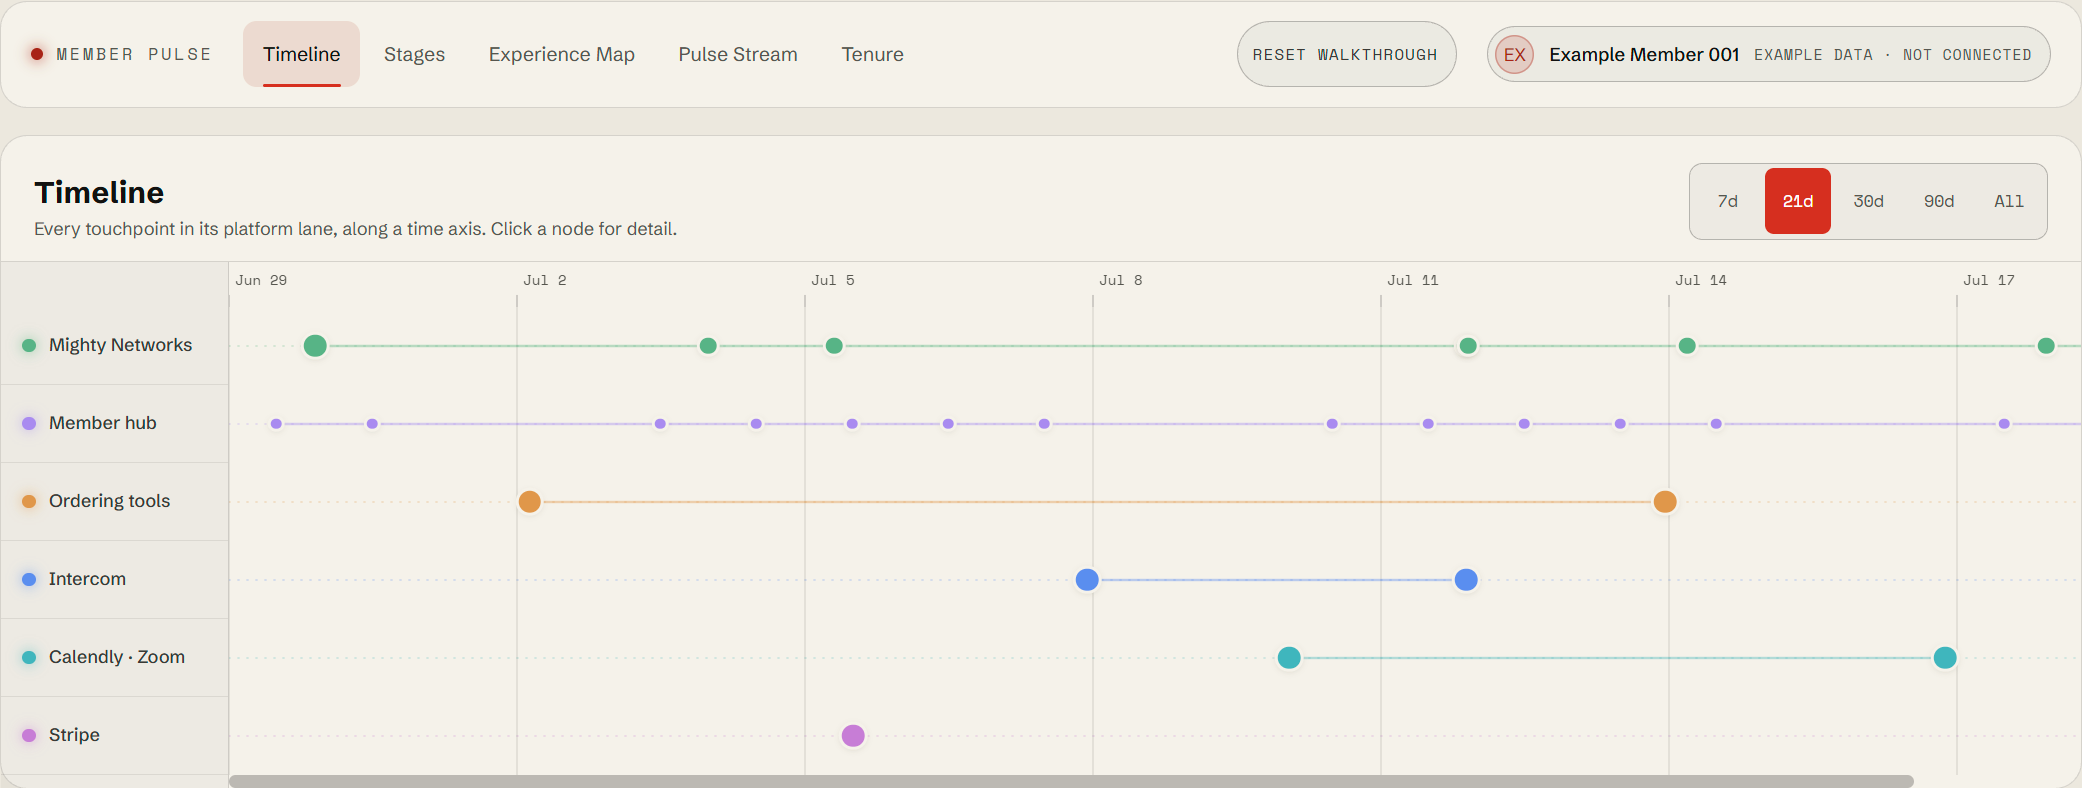
The timeline keeps platform lanes and dated interactions together. Open an event to inspect its detail, or change the date range to narrow the story.
Move between lifecycle and lived experience
Stages follows the journey from Lead to Advocate. Experience Map places the persona, touchpoints, wants, frustrations and source matrix together.
A score needs its inputs
Pulse Stream combines the interaction thread with the source-defined 12-signal health model. Churn risk, lead qualification, hard gates and signal notes remain inspectable.
Look across time, not just at one member
Reset returns the walkthrough to its starting state. No API calls, provider connections or persistent member updates are made.
The original file matters
This case now uses the recovered Member Pulse standalone application. The earlier spend, leads and revenue dashboard is a separate RevOps service presentation. Its newly authored n8n reporting blueprint is not the backend of this member-journey application.
Supporting views
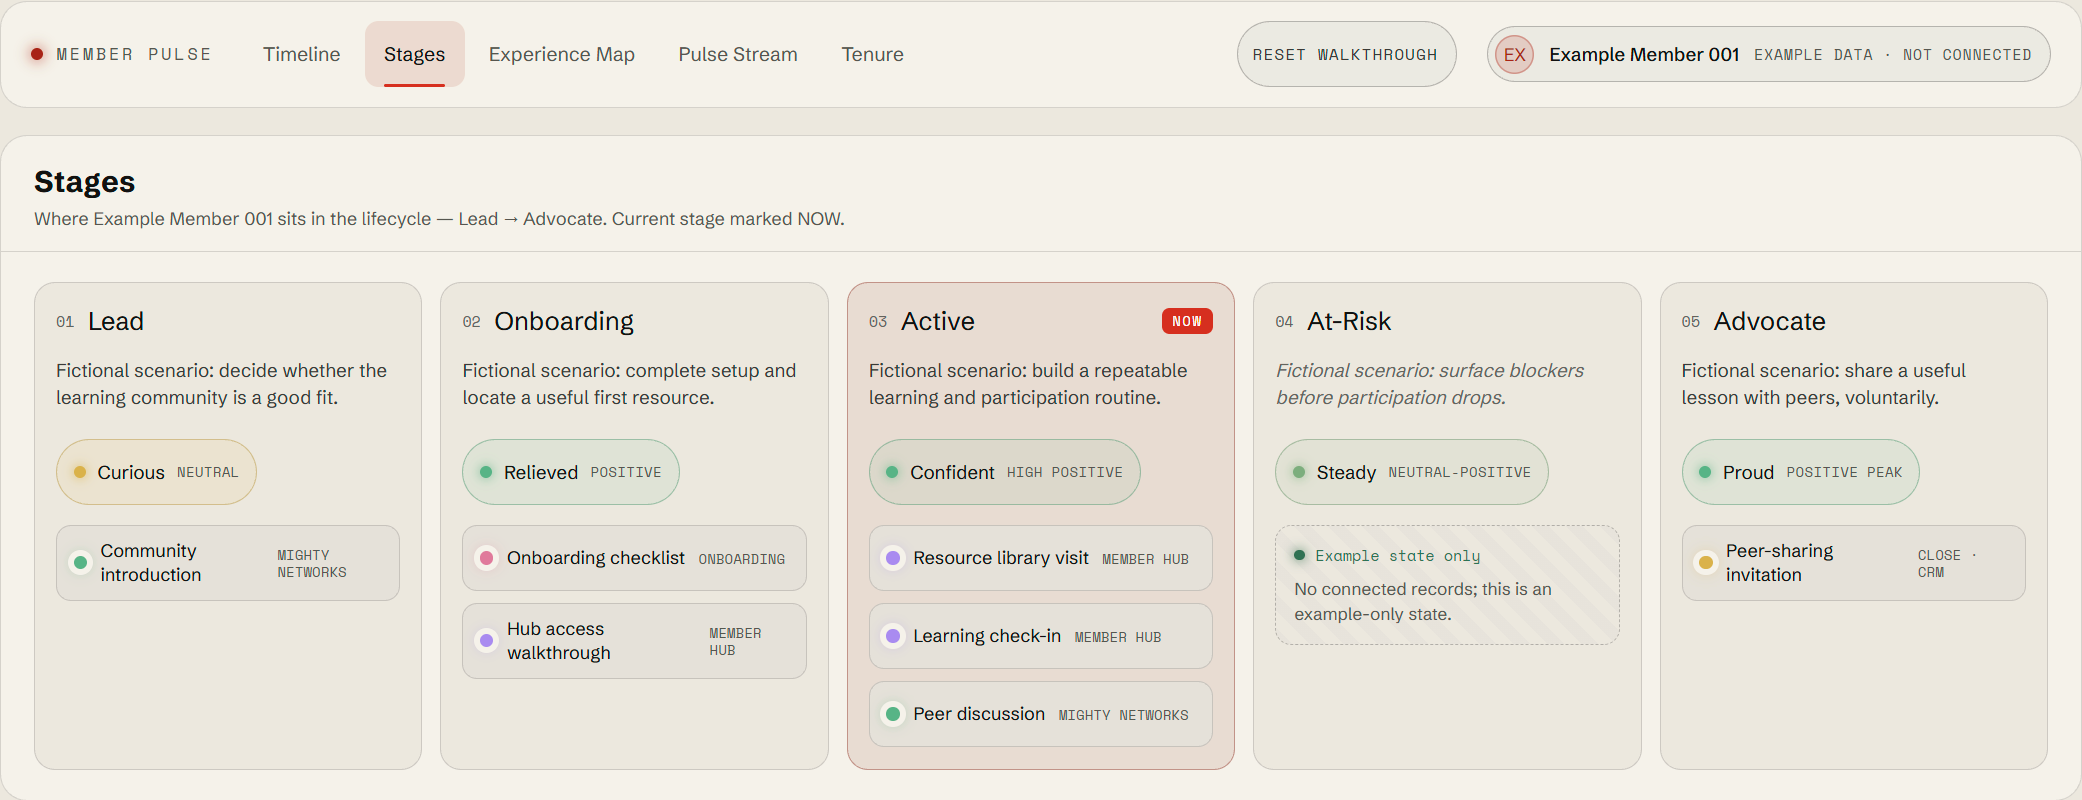
About this view
Viewport excerpt; open the walkthrough for the full interactive view.
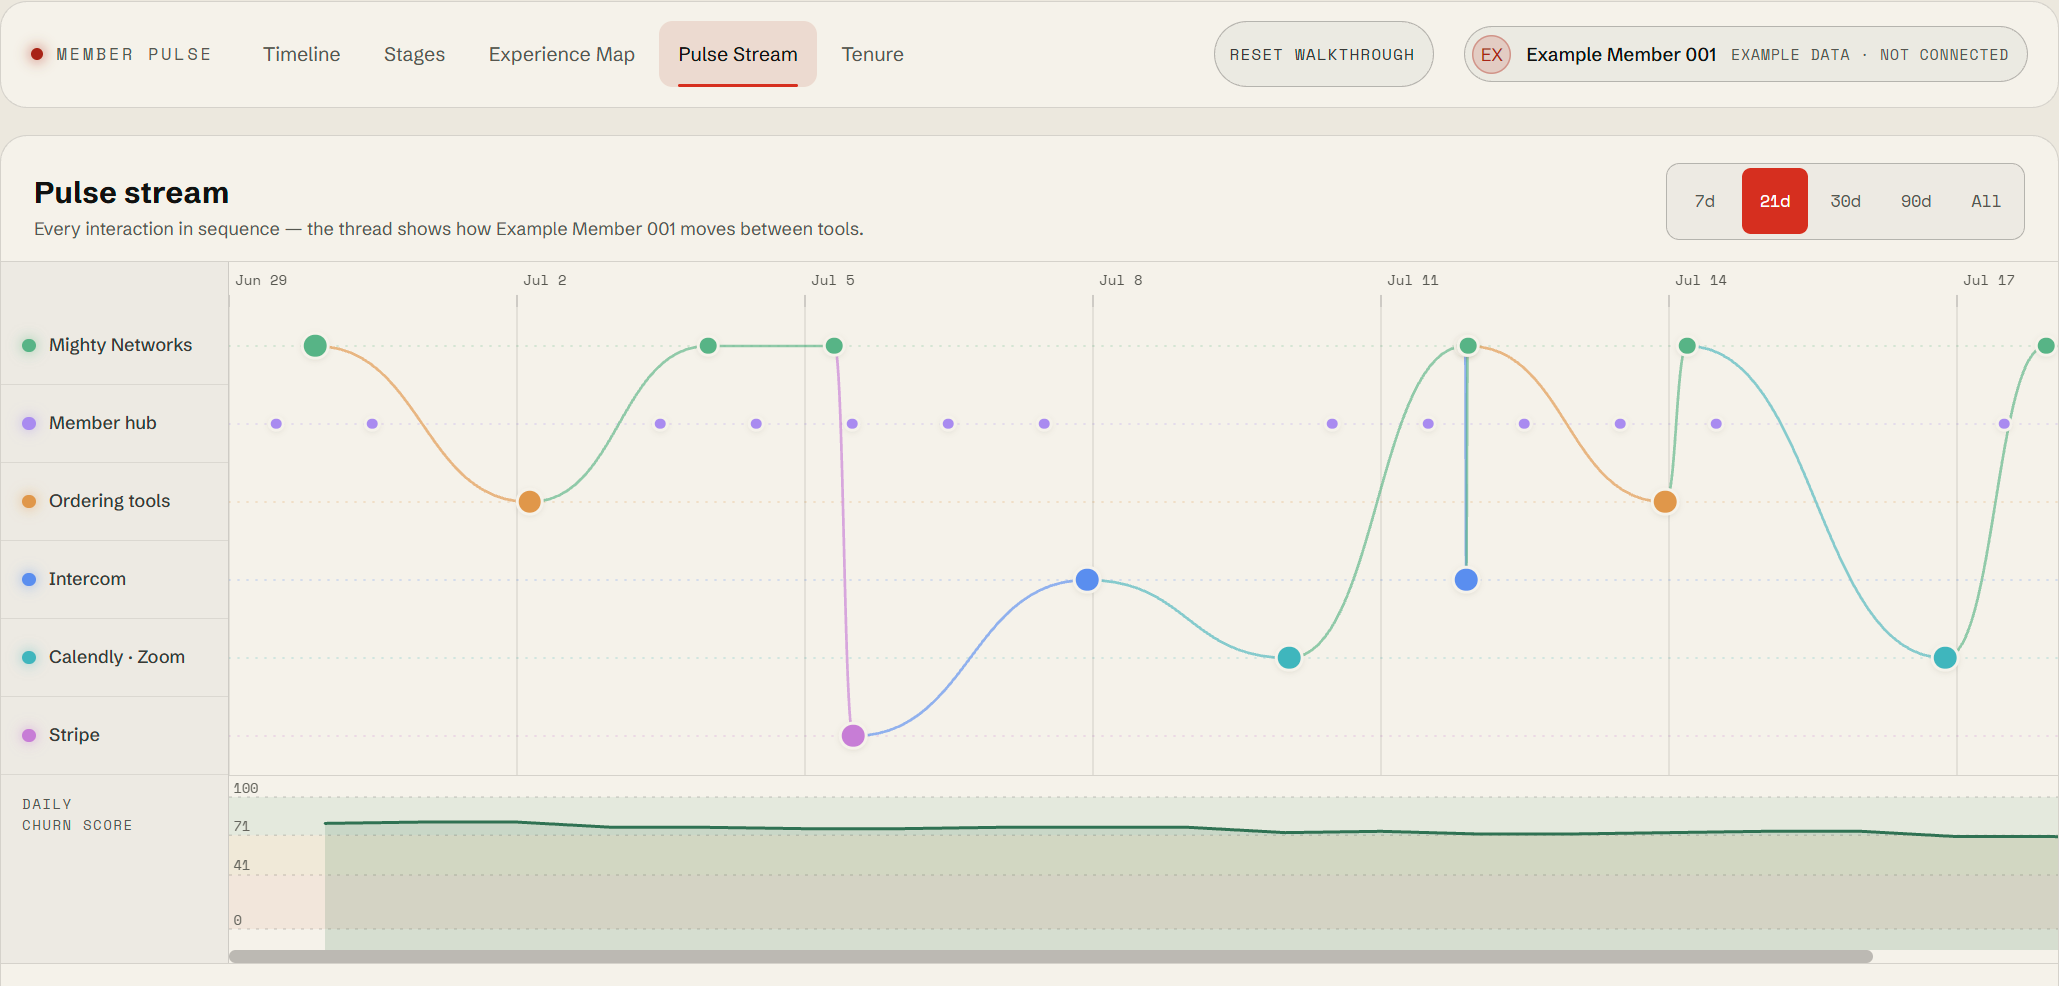
About this view
Viewport excerpt; open the walkthrough for the full interactive view.
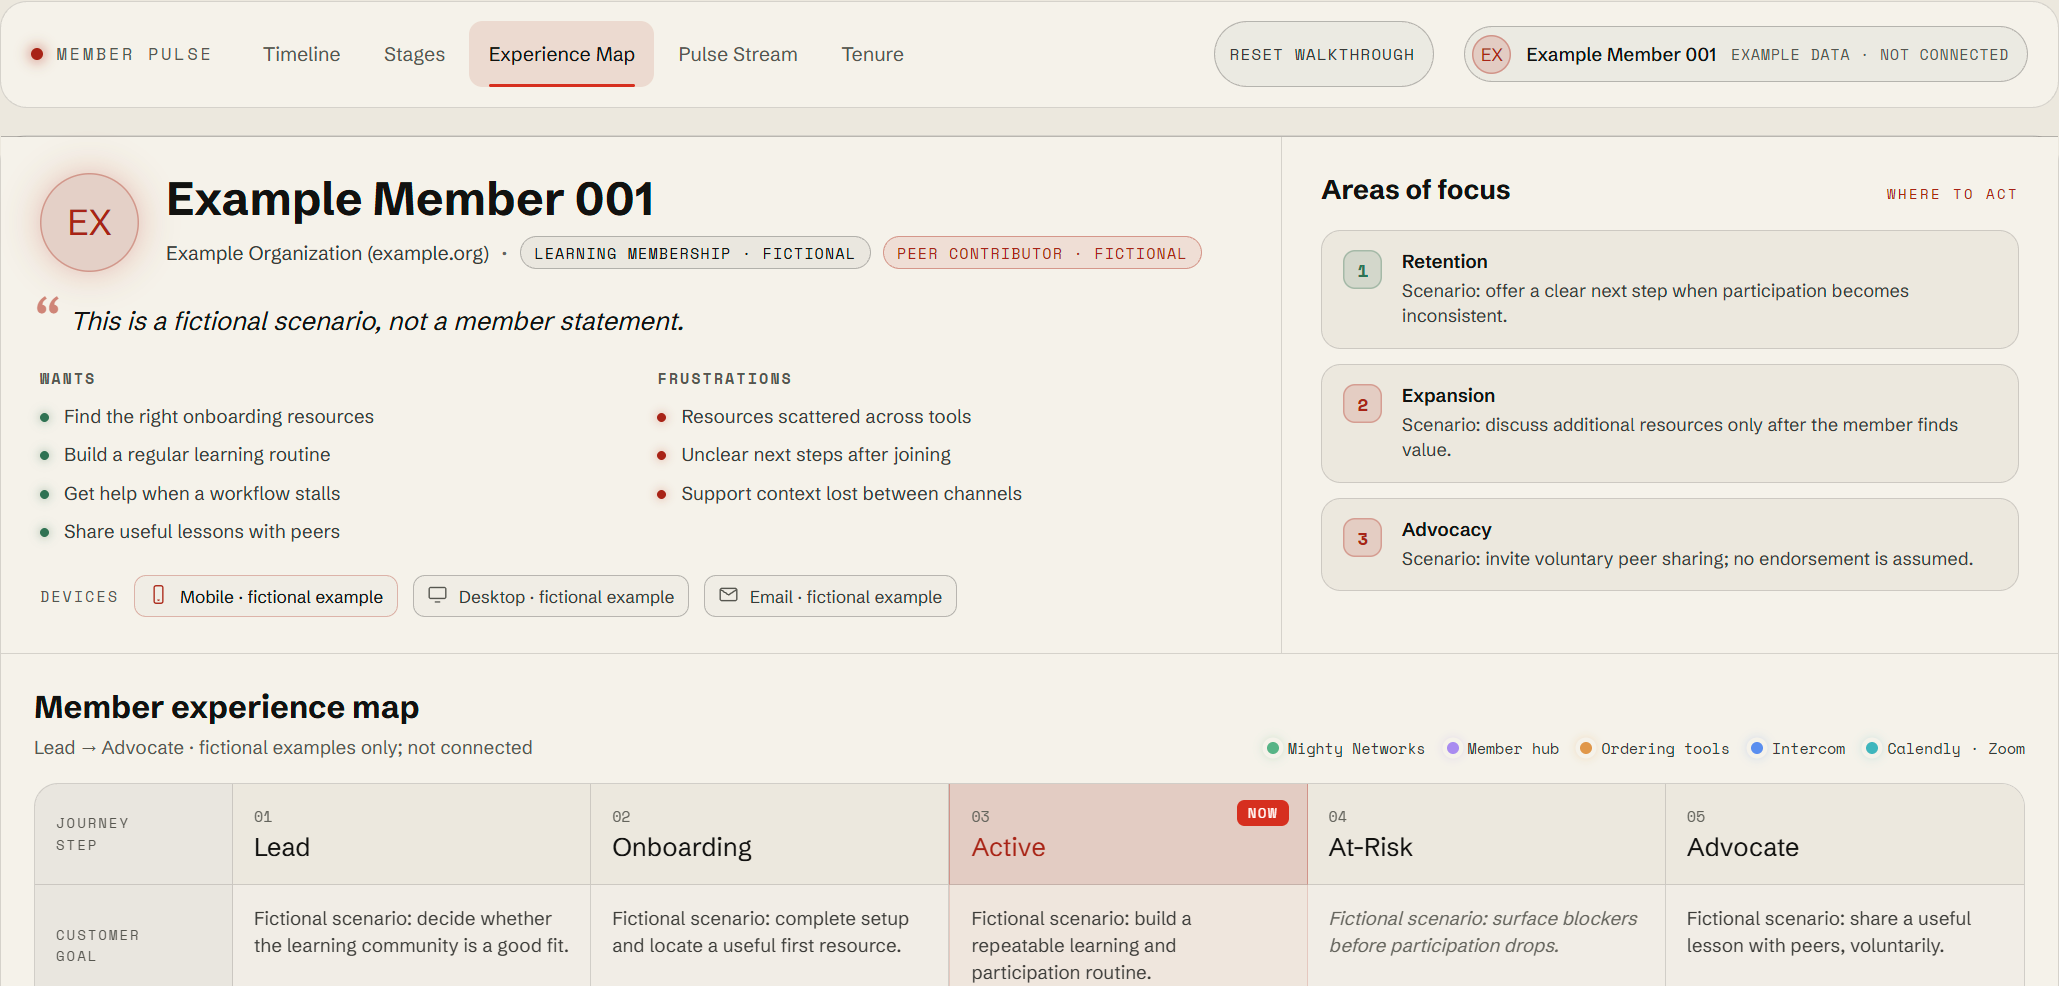
About this view
Viewport excerpt; open the walkthrough for the full interactive view.
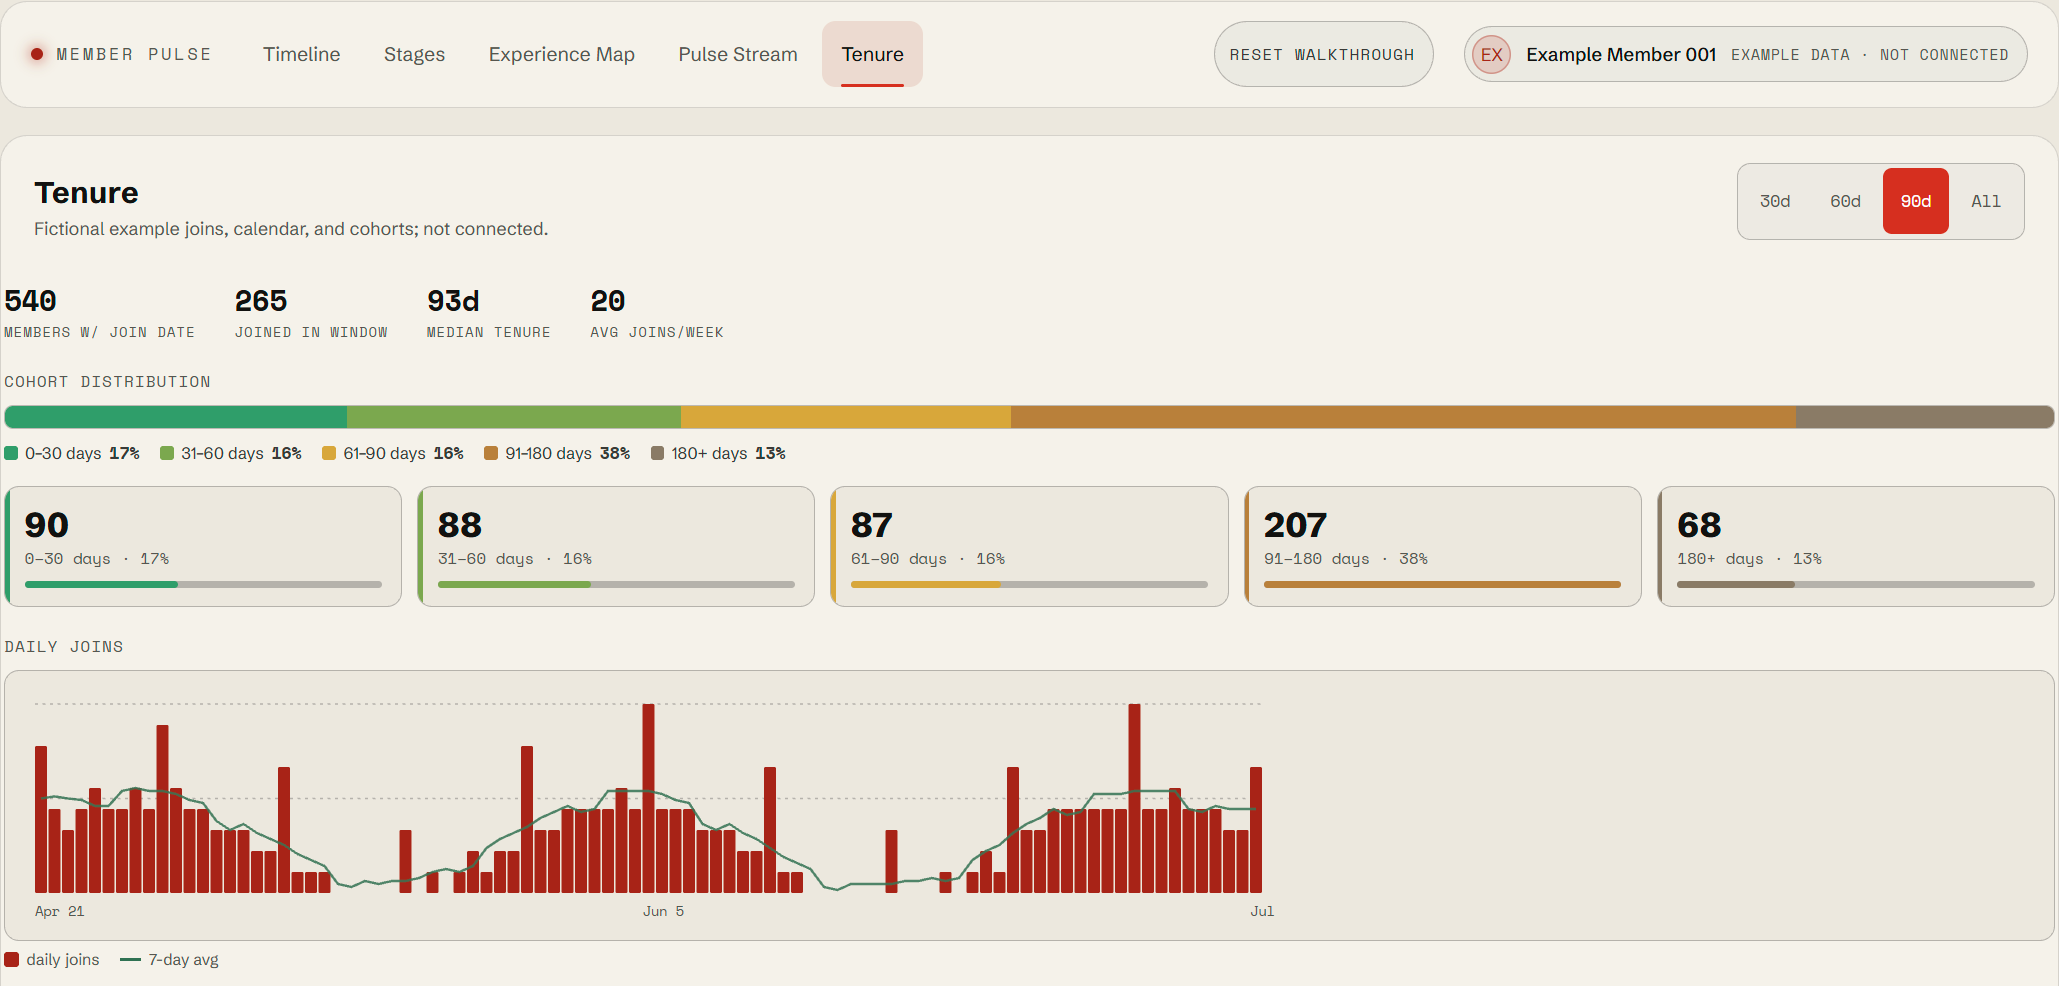
About this view
Viewport excerpt; open the walkthrough for the full interactive view.
About this view
Viewport excerpt; open the walkthrough for the full interactive view.